Difference: TFTDisplay (10 vs. 11)
Revision 112020-07-30 - UliRaich
| Line: 1 to 1 | ||||||||
|---|---|---|---|---|---|---|---|---|
TFT DisplaysIntroduction | ||||||||
| Line: 173 to 174 | ||||||||
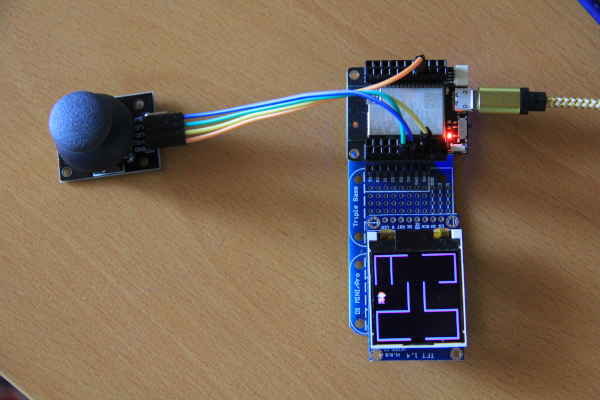
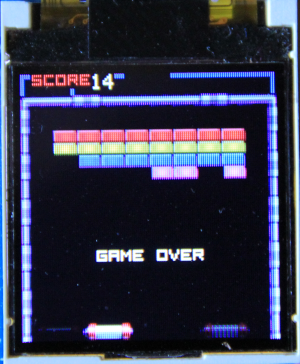
Both games need additional hardware: a joystick in case of Super Mario and a linear potentiometer in the case of Arkanoid. demo-mario orriginally used a Bluetooth based joystick, which we don't have. I therefore replaced it with the analogue joystick from our sensor kit. Of course the software needed to be adapted correspondingly.
| ||||||||
| Changed: | ||||||||
| < < |
| |||||||
| > > |
| |||||||
GUI elements in nanogui | ||||||||
| Line: 189 to 190 | ||||||||
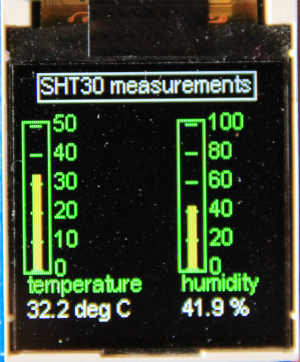
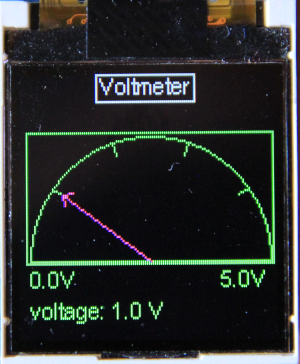
| to work with the ST7735 driver. I did not try alevel.py, written for the pyboard and making use of its accelerometer, which is not available on our ESP32 board. The color95.py program showing the meters, was adapted to present temperature and humidity values from SHT30 measurements and I created a "Scale" widget to be used as a voltmeter in conjunction with the ESP32 ADC.Particularly interesting is also the fplot.py library allowing to plot data in cartesian or polar coordinate and which has the facility to take data in real time as they are produced by the sensor. For more details please refer to https://github.com/peterhinch/micropython-nano-gui | ||||||||
| Added: | ||||||||
| > > |
| |||||||
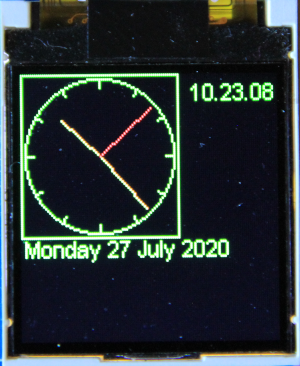
| The clock is Peter's original clock program adapted to the ST7735. The SHT30 meters are meter widgets from nanogui connected to real measurements from the SHT30. Yes, also in Europe we can have Ghanaian temperatures! even though relative humidity is substantially lower. | ||||||||
| Changed: | ||||||||
| < < | The voltmeter meter application uses a Scale widget, not part of nanogui. Peter has supplied a superclass DObject (displayable object) from which the Scale widget is derived. The demo connects to the ESP32 ADC to display measured signal levels. | |||||||
| > > | The voltmeter meter application uses a Scale widget, not part of nanogui. Peter has supplied a superclass DObject (displayable object) from which the Scale widget is derived. The demo connects to the ESP32 ADC to display measured signal levels. | |||||||
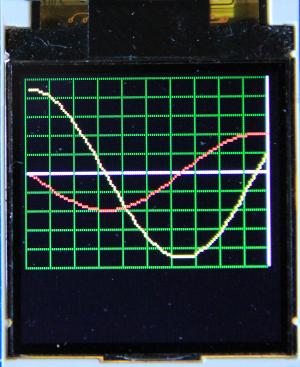
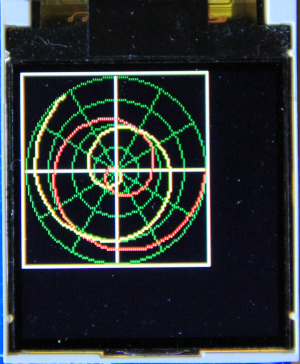
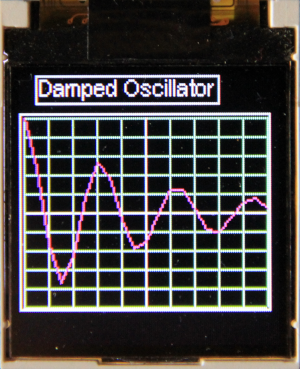
PlottingPeter's nanogui repository also contains a plotting package called fplot. This package allows to produce cartesian and polar plots to be generated. Particularly interesting is a feature that allows to add real time measurements to plots as they come in. | ||||||||
| Added: | ||||||||
| > > | Again a few examples:
| |||||||
-- Comments | ||||||||
| Line: 231 to 238 | ||||||||
| ||||||||
| Added: | ||||||||
| > > |
| |||||||
View topic | History: r13 < r12 < r11 < r10 | More topic actions...
Ideas, requests, problems regarding TWiki? Send feedback
