

| I | Attachment | History | Action | Size | Date | Who | Comment |
|---|---|---|---|---|---|---|---|
| |
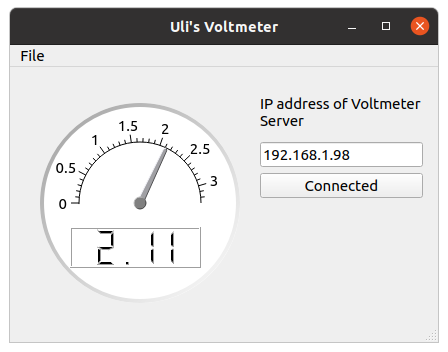
voltmeter.png | r1 | manage | 25.9 K | 2021-05-16 - 08:30 | UliRaich | |
| |
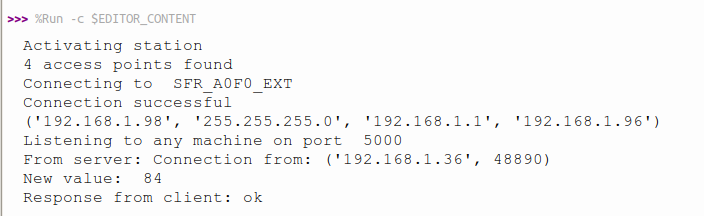
voltmeter_server.png | r1 | manage | 26.5 K | 2021-05-16 - 08:31 | UliRaich |

|
|
|
|
Ideas, requests, problems regarding TWiki? Send feedback