Difference: MinimalLectures (1 vs. 10)
Revision 102024-04-01 - UliRaich
Revision 92024-03-28 - UliRaich
| Line: 1 to 1 | |||||||||
|---|---|---|---|---|---|---|---|---|---|
Lecture notesSummary: | |||||||||
| Line: 35 to 35 | |||||||||
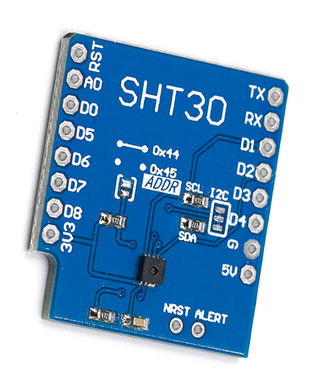
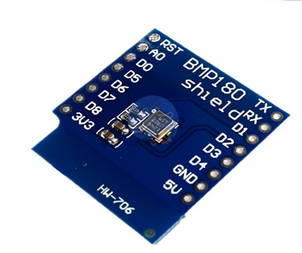
In the 2024 ASP edition, the IoT workshop has been extended to 2 1/2 days and we have a few new devices. First of all, we now have real sensors which measure air temperature, relative humidity and the barometric pressure. This will allow us to create a simplistic weather station.
| |||||||||
| Added: | |||||||||
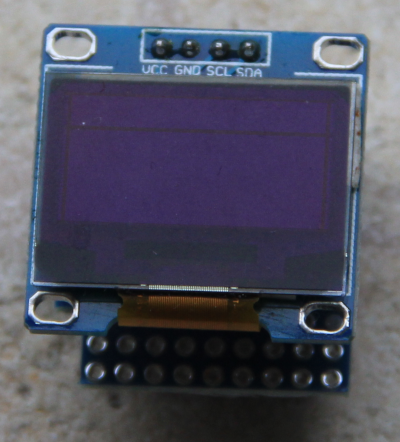
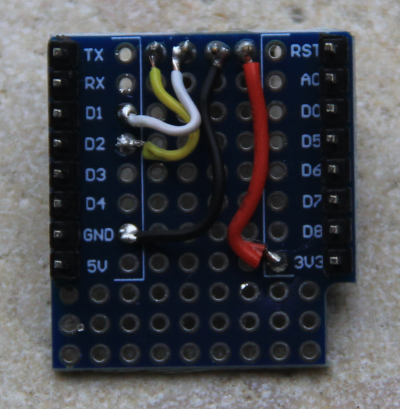
| > > | Often it is desirable to have a local display to show results without having to transfer data to a remote machine. A cheap monochrome OLED (Organic LED) display is available for the WeMos D1 mini bus but its resolution of 64x46 pixels is a bit too limited.
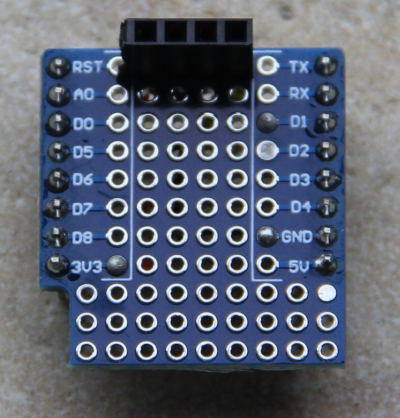
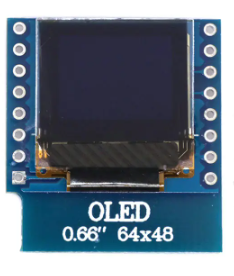 It is however easily possible to put an OLED with 128x64 pixels onto a prototype board, which I did for this workshop.
| ||||||||
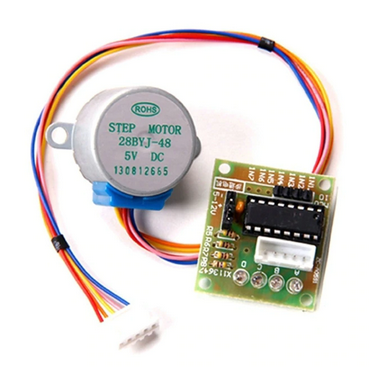
Also the actuators have been extended with a small stepping motor and its driver board and there are exercises to make the motor move forward and backwards in different modes and speeds.
| |||||||||
| Line: 56 to 63 | |||||||||
| |||||||||
| Added: | |||||||||
| > > |
| ||||||||
Revision 82024-03-26 - UliRaich
| Line: 1 to 1 | ||||||||
|---|---|---|---|---|---|---|---|---|
Lecture notesSummary: | ||||||||
| Line: 32 to 32 | ||||||||
| ||||||||
| Changed: | ||||||||
| < < | In the 2024 ASP edition, the IoT workshop has been extended to 2 1/2 days and we have a few new devices. First of all we now have real sensors which measure air temperature and relaitive humidity and the barometric pressure. This will allow us to create a simplistic weather station. | |||||||
| > > | In the 2024 ASP edition, the IoT workshop has been extended to 2 1/2 days and we have a few new devices. First of all, we now have real sensors which measure air temperature, relative humidity and the barometric pressure. This will allow us to create a simplistic weather station. | |||||||
| ||||||||
Revision 72024-03-26 - UliRaich
| Line: 1 to 1 | |||||||||||
|---|---|---|---|---|---|---|---|---|---|---|---|
Lecture notesSummary: | |||||||||||
| Line: 10 to 10 | |||||||||||
| Added: | |||||||||||
| > > | |||||||||||
IntroductionDuring the exercise sessions, we will first develop a program that lights the user programmable LED on the CPU card. This displays a binary signal, which can only be high or low. The exercise therefore demonstrates how to output a signal and how to control a single digital signal line. | |||||||||||
| Line: 25 to 27 | |||||||||||
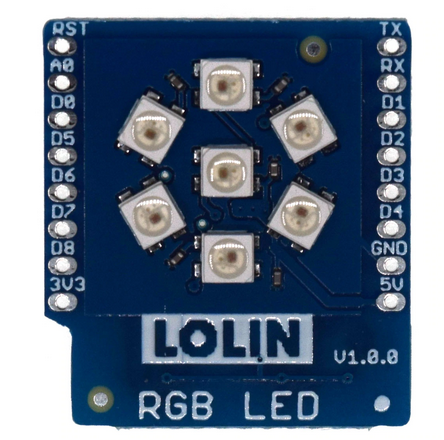
A slightly more complex program will allow us to read the signal level generated by an analogue sensor (our potentiometer) and display the signal level on the 7 LED rgb (red, green, blue) display. For this to work, we must first understand how to connect and read the analogue signal using the Analogue to Digital Converter (ADC). Then we must find out how an LED on the LED ring can be lit and how to select its color. Finally, we can again combine the two functions into a single program. This will read the signal level from the potentiometer and light one of the LEDs on the LED ring. For lowest signal levels, the top LED is lit in blue (which often represents a cold or low value). If the value is a bit higher, then the second LED is activated in cyan, After that we go clockwise using the colors (blue, cyan, green, yellow, magenta, red, white) where white will be displayed for the highest signal level on the center LED.
| |||||||||||
| Added: | |||||||||||
| > > |
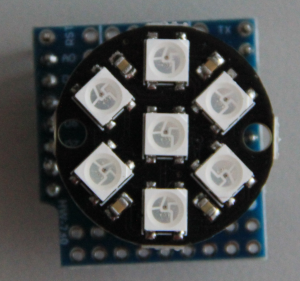
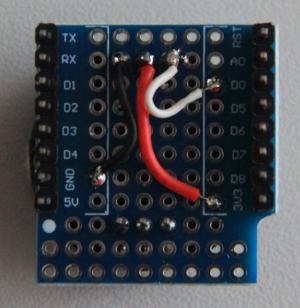
Unfortunately the LoLin RGB LED shield is not available any longer and our kits cannot be stocked up with this module. It is however possible to create a similar module using an LED ring together with a WeMos D1 mini prototype board. This is quite a bit of work and the LED addressing is different. The LoLin board addresses its LEDs in a clock-wise manner while the LED ring does this counter-clock-wise. With a mapping table, this problem can easily be resolved and the two versions will react the same way.
| ||||||||||
| Now that we know what we have to do, let's go for it! Communicating with the ESP32
- - | |||||||||||
| Line: 37 to 51 | |||||||||||
| |||||||||||
| Added: | |||||||||||
| > > |
| ||||||||||
Revision 62022-10-17 - UliRaich
| Line: 1 to 1 | ||||||||
|---|---|---|---|---|---|---|---|---|
Lecture notesSummary: | ||||||||
| Line: 9 to 9 | ||||||||
| Added: | ||||||||
| > > | ||||||||
IntroductionDuring the exercise sessions, we will first develop a program that lights the user programmable LED on the CPU card. This displays a binary signal, which can only be high or low. The exercise therefore demonstrates how to output a signal and how to control a single digital signal line. | ||||||||
Revision 52022-10-16 - UliRaich
| Line: 1 to 1 | ||||||||
|---|---|---|---|---|---|---|---|---|
Lecture notesSummary: | ||||||||
| Line: 7 to 7 | ||||||||
| Added: | ||||||||
| > > | ||||||||
IntroductionDuring the exercise sessions, we will first develop a program that lights the user programmable LED on the CPU card. This displays a binary signal, which can only be high or low. The exercise therefore demonstrates how to output a signal and how to control a single digital signal line. | ||||||||
Revision 42022-10-15 - UliRaich
| Line: 1 to 1 | ||||||||
|---|---|---|---|---|---|---|---|---|
Lecture notesSummary: | ||||||||
| Line: 6 to 6 | ||||||||
| Added: | ||||||||
| > > | ||||||||
IntroductionDuring the exercise sessions, we will first develop a program that lights the user programmable LED on the CPU card. This displays a binary signal, which can only be high or low. The exercise therefore demonstrates how to output a signal and how to control a single digital signal line. | ||||||||
Revision 32022-10-15 - UliRaich
| Line: 1 to 1 | ||||||||
|---|---|---|---|---|---|---|---|---|
Lecture notes | ||||||||
| Added: | ||||||||
| > > | Summary:
| |||||||
IntroductionDuring the exercise sessions, we will first develop a program that lights the user programmable LED on the CPU card. This displays a binary signal, which can only be high or low. The exercise therefore demonstrates how to output a signal and how to control a single digital signal line. | ||||||||
| Line: 16 to 21 | ||||||||
A slightly more complex program will allow us to read the signal level generated by an analogue sensor (our potentiometer) and display the signal level on the 7 LED rgb (red, green, blue) display. For this to work, we must first understand how to connect and read the analogue signal using the Analogue to Digital Converter (ADC). Then we must find out how an LED on the LED ring can be lit and how to select its color. Finally, we can again combine the two functions into a single program. This will read the signal level from the potentiometer and light one of the LEDs on the LED ring. For lowest signal levels, the top LED is lit in blue (which often represents a cold or low value). If the value is a bit higher, then the second LED is activated in cyan, After that we go clockwise using the colors (blue, cyan, green, yellow, magenta, red, white) where white will be displayed for the highest signal level on the center LED.
| ||||||||
| Changed: | ||||||||
| < < | Now that we know what we have to do, let's go for it! Programming Python | |||||||
| > > | Now that we know what we have to do, let's go for it! Communicating with the ESP32 | |||||||
|
- - | ||||||||
Revision 22022-10-15 - UliRaich
| Line: 1 to 1 | ||||||||
|---|---|---|---|---|---|---|---|---|
Lecture notesIntroduction | ||||||||
| Changed: | ||||||||
| < < | During the exercise sessions, we will first develop a program that lights the user programmable LED on the CPU card. This displays a binary signal, which can only be high or low. | |||||||
| > > | During the exercise sessions, we will first develop a program that lights the user programmable LED on the CPU card. This displays a binary signal, which can only be high or low. The exercise therefore demonstrates how to output a signal and how to control a single digital signal line. | |||||||
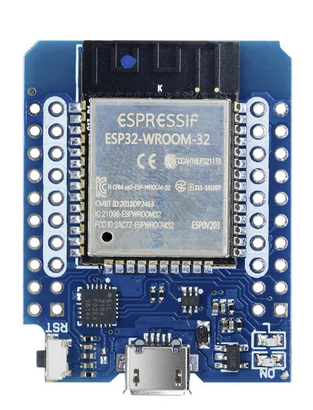 On the bottom right of the photo, you see 2 LEDs. The lower one marked ON (upside down) shows if power is supplied to the board, the upper one is user programmable.
 | ||||||||
| Changed: | ||||||||
| < < | Then we will read a digital actuator, namely a simple push button switch, and we will display its current value (pushed or released) on the PC screen. After that, we may switch the LED on when the button is pressed and switch it off, when the button is released, thus combining the acquisition of a digital sensor with the display of its state. | |||||||
| > > | As a second exercise we will read a digital actuator, namely a simple push button switch, and we will display its current value (pushed or released) on the PC screen. This exercise therefore demonstrates how to acquire the state of a digital signal. After that, we may switch the LED on, when the button is pressed, and switch it off, when the button is released, thus combining the acquisition of a digital sensor with the display of its state. | |||||||
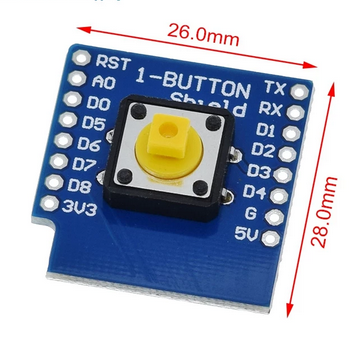 A slightly more complex program will allow us to read the signal level generated by an analogue sensor (our potentiometer) and display the signal level on the 7 LED rgb (red, green, blue) display. For this to work, we must first understand how to connect and read the analogue signal using the Analogue to Digital Converter (ADC). Then we must find out how an LED on the LED ring can be lit and how to select its color. Finally, we can again combine the two functions into a single program. This will read the signal level from the potentiometer and light one of the LEDs on the LED ring. For lowest signal levels, the top LED is lit in blue (which often represents a cold or low value). If the value is a bit higher, then the second LED is activated in cyan, After that we go clockwise using the colors (blue, cyan, green, yellow, magenta, red, white) where white will be displayed for the highest signal level on the center LED.
| ||||||||
| Changed: | ||||||||
| < < | Now the we know what we have to do, let's go! Programming Python | |||||||
| > > | Now that we know what we have to do, let's go for it! Programming Python | |||||||
|
- - | ||||||||
Revision 12022-10-14 - UliRaich
| Line: 1 to 1 | |||||||||||||
|---|---|---|---|---|---|---|---|---|---|---|---|---|---|
| Added: | |||||||||||||
| > > |
Lecture notesIntroductionDuring the exercise sessions, we will first develop a program that lights the user programmable LED on the CPU card. This displays a binary signal, which can only be high or low. On the bottom right of the photo, you see 2 LEDs. The lower one marked ON (upside down) shows if power is supplied to the board, the upper one is user programmable.
Then we will read a digital actuator, namely a simple push button switch, and we will display its current value (pushed or released) on the PC screen. After that, we may switch the LED on when the button is pressed and switch it off, when the button is released, thus combining the acquisition of a digital sensor with the display of its state.
 A slightly more complex program will allow us to read the signal level generated by an analogue sensor (our potentiometer) and display the signal level on the 7 LED rgb (red, green, blue) display. For this to work, we must first understand how to connect and read the analogue signal using the Analogue to Digital Converter (ADC). Then we must find out how an LED on the LED ring can be lit and how to select its color. Finally, we can again combine the two functions into a single program. This will read the signal level from the potentiometer and light one of the LEDs on the LED ring. For lowest signal levels, the top LED is lit in blue (which often represents a cold or low value). If the value is a bit higher, then the second LED is activated in cyan, After that we go clockwise using the colors (blue, cyan, green, yellow, magenta, red, white) where white will be displayed for the highest signal level on the center LED.
Comments
| ||||||||||||
View topic | History: r10 < r9 < r8 < r7 | More topic actions...
Ideas, requests, problems regarding TWiki? Send feedback
