The Hantek 6022BE Digital Storage Oscilloscope
For the course on embedded systems we need an oscilloscope to be able to see certain signals created by micro-controller code. These signals are have a signal level of either 5V or 3.3V and are rather slow. These means that a rather limited but cheap scope is good enough for us.The Hantek 6022BE has a sampling rate of 48 MHz or a bandwidth of some 20 MHz. To make things really cheap it uses an USB interface and the display capabilities of a PC to display scope traces and a graphical user interface (GUI) of the PC to control timebase, signal sensitivity and trigger level. Don’t expect features you will get on a 10 kUS$ Textronix scope, you will quickly hit the limitations of the 6022BE, however it should meet the requirements imposed by the course exercises.
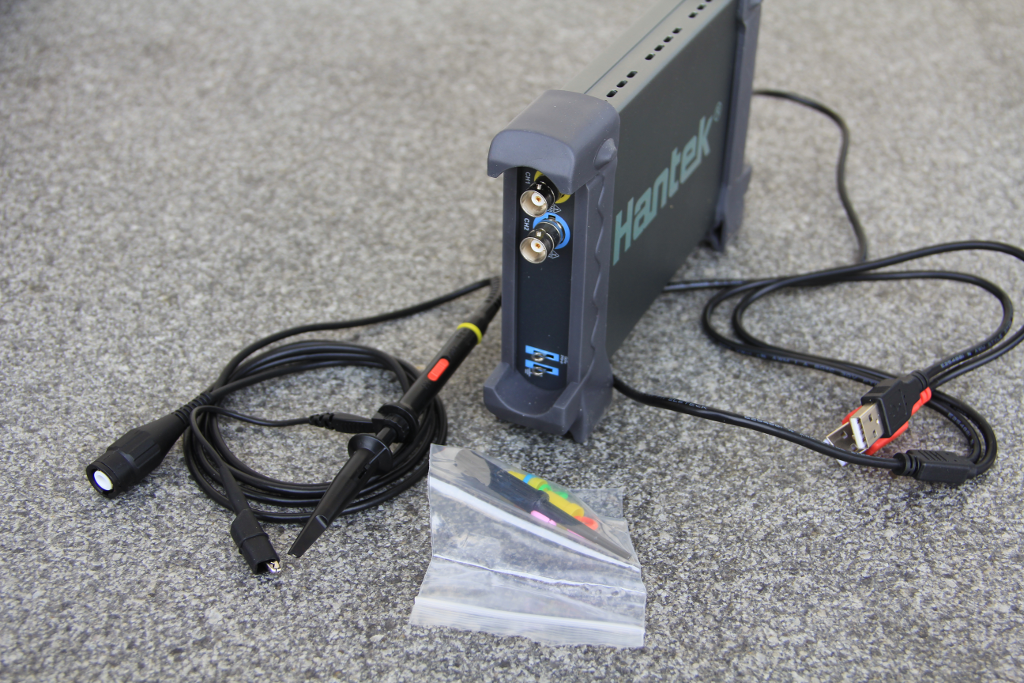
The Hantek 6022BE has 2 DC coupled input channels, a calibration signal generator emitting a square signal and it is delivered with 2 80 MHz probes and a USB cable to connect it to the PC. In addition to this you get a mini CD with Windows software implementing a GUI based control program and a software development kit which allows to implement your own code.
The scope is based on a Cypress CY7C68013A chip, which is essentially a 8051 μ Controller with built in RAM, I2C and USB interface. An external I2C EPROM is used to store USB Vendor and Product ID as well as a few calibration parameters.
When the scope is plugged into the Windows PC a driver is started downloading firmware into the Cypress RAM making it ready for operation. The code is stored in RAM and must therefore re-loaded each time the scope is powered. Once the firmware is loaded the Vendor ID is changed making the scope looks like a different device. This is how the Windows application looks like:
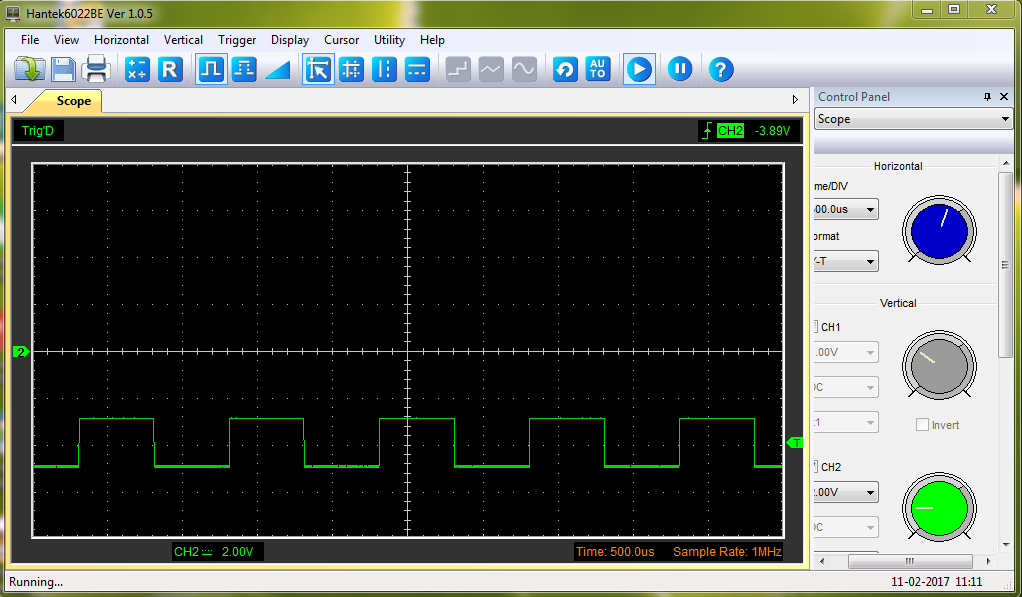 Channel B is connected to the calibration signal which tells us that this is a 1 kHz square wave.
The horizontal time base can be selected between 1,2,5,10,20,50,100,200,500 ns/division up to
1,2,5 s/division. Of course 1 ns/division is pretty useless on 20 MHz scope. The vertical sensitivity can be selected from 20 mV to 5V per division. You can trigger the scope in
- auto mode
- normal mode
- or single shot
- channel A + channel B
- channel A - channel B
- channel A * channel B
- channel A / channel B
- FFT (Fast Fourier Transform) showing the frequency content of the signal
Running the Hantek 6022BE under Linux
Just like in the Windows case we must first first load the scope with its firmware. There are different ways to do this:use udev rules to load the firmware using the fxload program
make the application program load the firmware if it is not loaded yet
When is scope is plugged in without the firmware being loaded it announces itself as a Cypress Semiconductor device with Vendor ID 0x04b4.
 This changes to ROHM LSI Systems (a company that probably has nothing to do with this scope) because the Vendor ID has changed to 0x4b5.

When browsing the WEB for information of the Hantek 6022BE under Linux, this is what I found:
Openhantek
Then there is a driver implementation
Then there is hantek6022api
The 8051 code is given as source code as well as disassembled original code from Hantek. It also supplies a program that allows the user to read out the RAM and EPROM contents.
On my dual boot PC I loaded the original Hantek firmware into the scope, then rebooted into Linux and used the example_linux_readfirmware.py included in hantek6022api to extract this code. After disassembly with dis51 I was able to compare the code with the one included as stock firmware in hantek602api to confirm that they are identical.
Cypress, the producer of the CY7C68013A chip provides a the cyusb library
Finally there is the sigrok
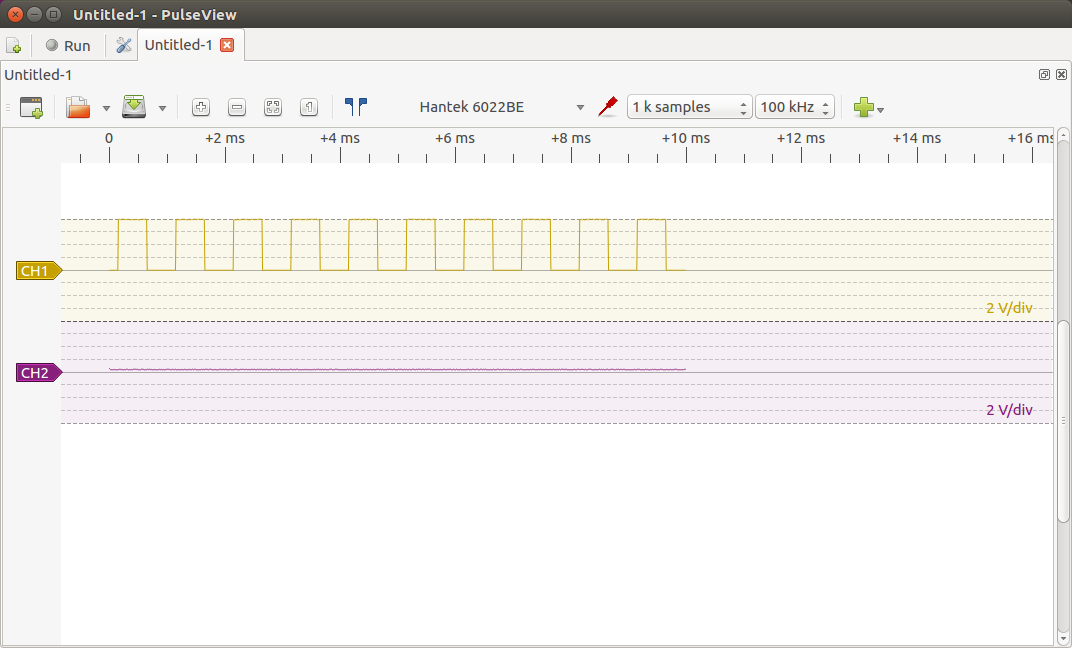 The above screen dump shows the trace read from the Hantek6022be when the probe is connected to the calibration pulse generator.
Some specs
Depending on the sampling rate the number of samples that can be read changes with the more samples the slower you sample. Here is a table showing the buffer size to be read back: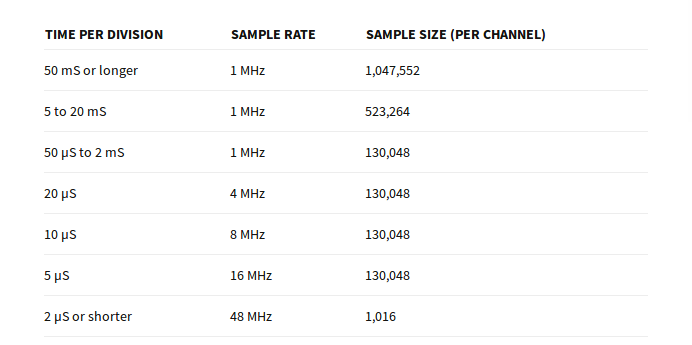
Bringing up openhantek
There are quite a few versions of openhantek floating around on the WEB. The latest one seems to be this one.-
libDemoDevice: this one generates a sine wave with which the program can be tested and therefore does not need any hardware
-
libOpenHantek2xxx-5xxx: this is the access code for the more expensive Hantek scopes
-
libOpenHantek60xx: this is the library of access code we are interested in. It is based on hantek driver
 mentioned earlier.
-
libusbDSO containing the access routines to USB which are common to all scopes (except of the demoDevice of course)
-
libPostprocessingDSO which contains code for post process the traces including FFTs.
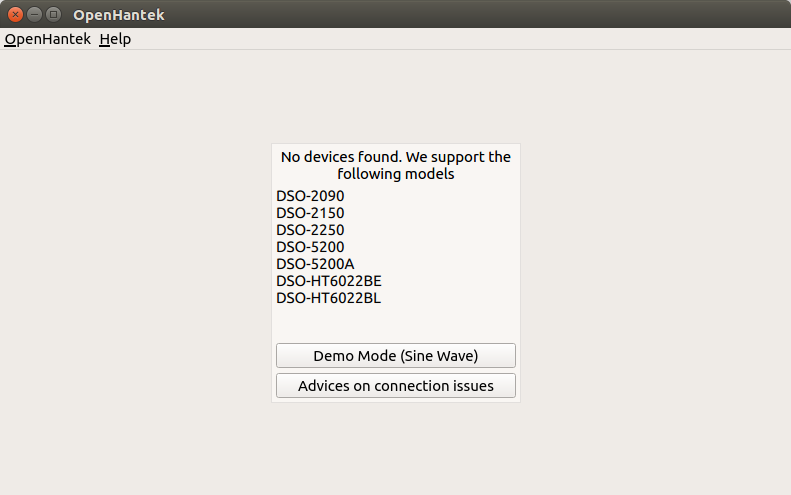 Of course it is normal that it does not find any Hantek scope as long as noting is connected to the PC. I first want to get the demoDevice working and when selecting it, this is what I see (after quite a bit of further debugging):
After some modifications of the GUI, some additions etc. the mr_split_gui_backend shows essentially the same GUI as the original openhantek version except that the opengl widget for display of the traces is replaced by the qtquickplot widget. Unfortunately also the sliders for the trigger level, offset adjustment and cursors are missing.
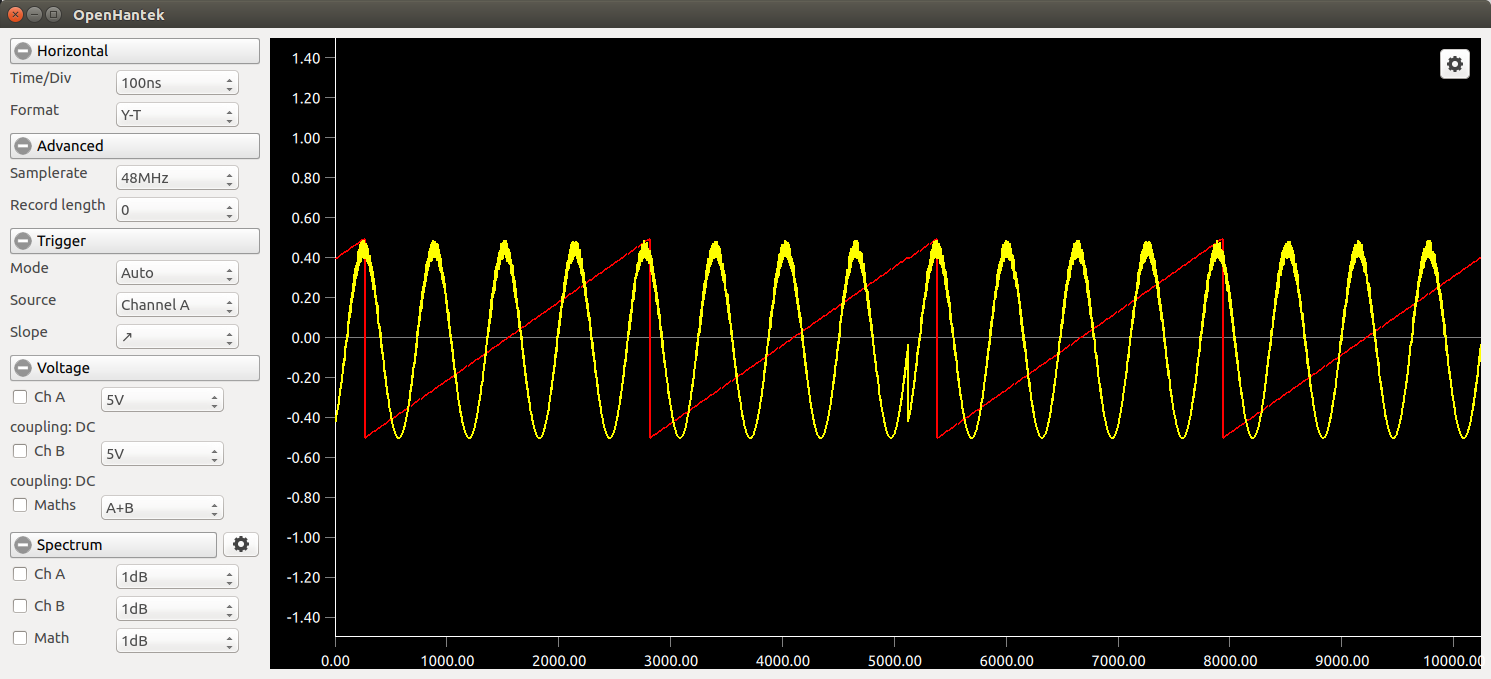 For comparison, this is how the original GUI looks like:
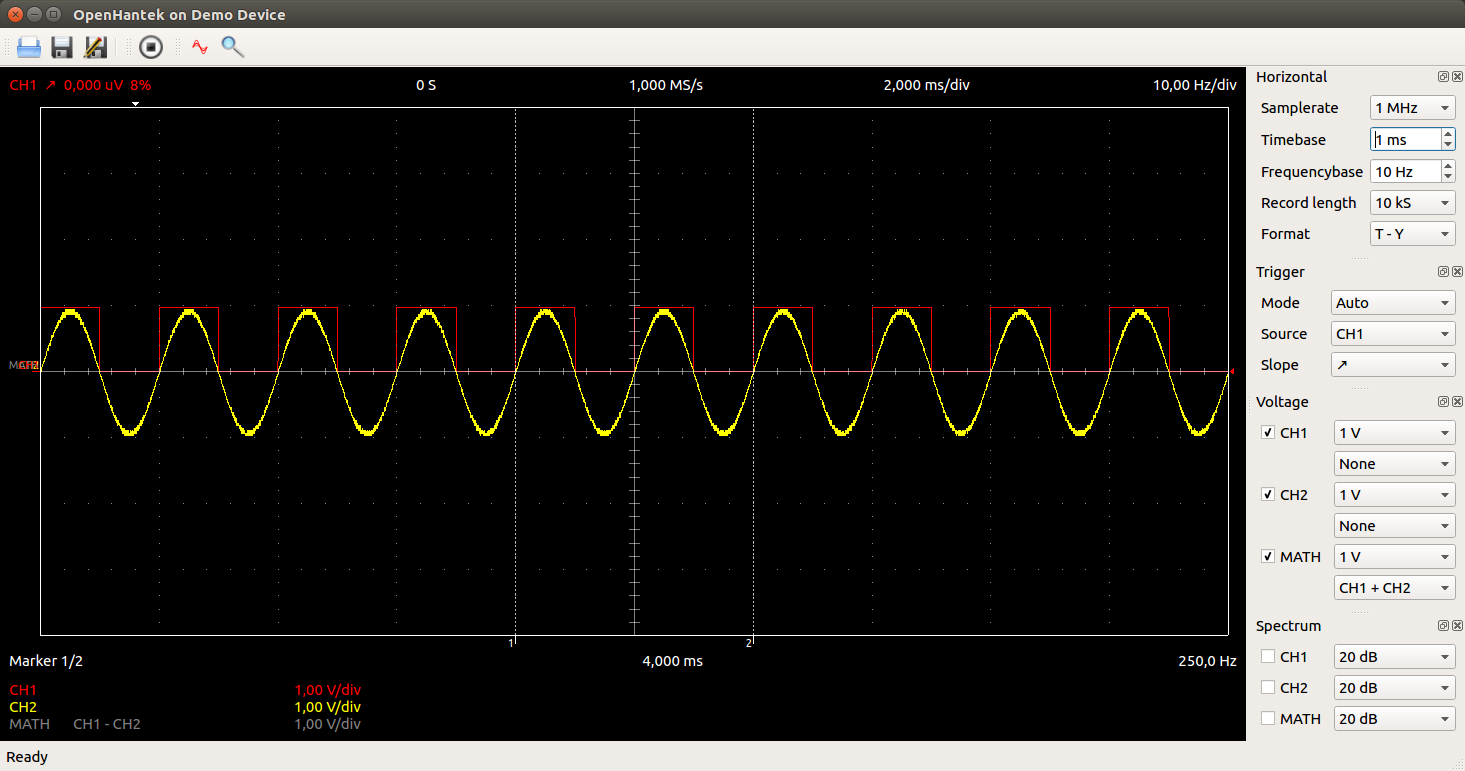
Basic components of OpenHantek
As explained above, the new openhantek program (called openhantek2 in git) is missing a lot the the GUI elements needed to run the scope. On the other hand it nicely separates the scope functionality putting it into libraries. It has the additional advantage that the demo device, which simply generates a sine wave (with some noise added) and a triangular signal, can be used for all GUI testing such that the hardware is not needed for most of the work. The original openhantek program on the other hand has all necessary GUI elements. I therefore decided to try combining both, using the libraries from the new program and the GUI from the old one. The screen dump above shows the demo device with the old GUI.Mapping the traces to the plots
Vertical mapping The grids of the openhantek scope are 8 units high (-4 - +4) and 10 units wide (-5 - +5). The scope trace must be mapped to these dimensions. Since the scope hardware has got an 8 bit ADC values 0..250 must be mapped to -4..+4. In addition we must take into account the hardware gain that can be set on the scope. The following table shows the available hardware gains on the first column, the gain settings in V/div in the second one, the max voltages that can be displayed in the plot and the last column shows the multiplication factor needed to map the values from the scope to the screen.| Gain Setting [V] | V/div | Total size on plot [V] | Multiplication Factor |
|---|---|---|---|
| 1 | 10 mV | 0.08 | 12.5 |
| 1 | 20 mV | 0.16 | 6.25 |
| 1 | 50 mV | 0.4 | 5 |
| 1 | 100 mV | 0.8 | 1.25 |
| 1 | 200 mV | 1.6 | 0.625 |
| 2 | 0.5 V | 4 | 0.5 |
| 5 | 1 V | 8 | 0.625 |
| 10 | 2 V | 16 | 0.625 |
| 10 | 5 V | 40 | 0.25 |
From the table we can see that for 5V/div only ¼ of the ADC resolution is reached while for 100mV/division and below the signal will be saturated. Horizontal mapping Horizontally we have to take into account
-
the timebase selected
-
the sampling rate
-
the record size needed to display the full trace
| Timebase per div | Total horizontal Size | Sampling Rate | Record Size | Down Sampling Factor |
|---|---|---|---|---|
| 1s | 10 s | 100 kHz | 1 MS -> 10 kS | 100 |
| 500 ms | 5 s | 100 kHz | 500 kS -> 10 kS | 50 |
| 200 ms | 2 s | 100 kHz | 200 kS -> 10 kS | 20 |
| 100 ms | 1 s | 100 kHz | 100 kS -> 10 kS | 10 |
| 50 ms | 500 ms | 100 kHz | 50 kS -> 10 kS | 5 |
| 20 ms | 200 ms | 100 lHz | 20 kS | 1 |
| 10 ms | 100 ms | 200 kHz | 10 kS | 1 |
| 5 ms | 50 ms | 200 kHz | 10 kS | 1 |
| 2 ms | 20 ms | 1 MHz | 20 kS | 1 |
| 1 ms | 10 ms | 1 MHz | 10 kS | 1 |
| 500 us | 5 ms | 1 MHz | 5 kS | 1 |
| 200 us | 2 ms | 1 MHz | 2 kS | 1 |
| 100 us | 1 ms | 1 MHz | 1 kS | 1 |
| 50 us | 500 us | 1 MHz | 500 S | 1 |
| 20 us | 200 us | 4 MHz | 800 S | 1 |
| 10 us | 100 us | 8 MHz | 800 S | 1 |
| 5 us | 50 us | 16 MHz | 800 S | 1 |
| 2 us | 20 us | 48 MHz | 1016 S (hardware max) | 1 |
 --
-- Comments
| I | Attachment | History | Action | Size | Date | Who | Comment |
|---|---|---|---|---|---|---|---|
| |
Hantek6022be.png | r1 | manage | 1180.6 K | 2017-02-09 - 16:32 | UnknownUser | |
| |
clean_build1.png | r1 | manage | 128.1 K | 2017-04-09 - 15:19 | UnknownUser | |
| |
clean_build2.png | r1 | manage | 126.0 K | 2017-04-09 - 15:22 | UnknownUser | |
| |
demoDevice1ms.png | r1 | manage | 89.6 K | 2017-04-09 - 18:54 | UnknownUser | |
| |
demoDevice500us.png | r1 | manage | 92.9 K | 2017-04-09 - 19:00 | UnknownUser | |
| |
import_openhantek.png | r1 | manage | 82.0 K | 2017-04-09 - 14:57 | UnknownUser | |
| |
lsusb-1.png | r1 | manage | 27.2 K | 2017-01-24 - 20:47 | UnknownUser | lsusb before loading firmware |
| |
lsusb-2.png | r1 | manage | 34.5 K | 2017-01-24 - 20:48 | UnknownUser | lsusb after loading firmware |
| |
openhantek-v2.tar.gz | r1 | manage | 4530.0 K | 2017-10-16 - 11:57 | UnknownUser | |
| |
openhantek.tar.gz | r1 | manage | 1706.8 K | 2017-03-15 - 08:11 | UnknownUser | |
| |
openhantek1.png | r1 | manage | 39.1 K | 2017-03-14 - 12:45 | UnknownUser | |
| |
openhantek2.tar.gz | r1 | manage | 2971.5 K | 2017-03-19 - 10:17 | UnknownUser | |
| |
pulseview.png | r1 | manage | 50.8 K | 2017-01-24 - 20:50 | UnknownUser | pulseview |
| |
qmlGUI.png | r1 | manage | 108.0 K | 2017-03-14 - 12:45 | UnknownUser | |
| |
qtcreator.png | r1 | manage | 65.7 K | 2017-04-09 - 14:51 | UnknownUser | |
| |
sampleSize.png | r1 | manage | 16.3 K | 2017-03-14 - 12:36 | UnknownUser | |
| |
windowsSoft.png | r1 | manage | 104.6 K | 2017-02-11 - 11:46 | UnknownUser |
Ideas, requests, problems regarding TWiki? Send feedback


