MQTT and Cayenne
Exercise 1:
Install mosquitto on your machine. On Ubuntu Linux this can very easily be accomplished with apt. Try the mosquitto communication:-
Start the mosquitto broker
-
Start mosquitto_sub subscribing to the “DCSIT” topic
-
Start mosquitto_pub publishing some message to the topic “DCSIT
-
observe the message being seen in mosquitto_sub
Exercise 2:
Write you own MQTT client in Python publishing a message to “DCSIT” every 2 s. Have a look at the umqtt.simple classExercise 3:
Register a user on https://mydevices.com/cayenne/signupExercise 4:
Write a program connecting to Cayenne. Observe that the dashboard is coming up.Exercise 5:
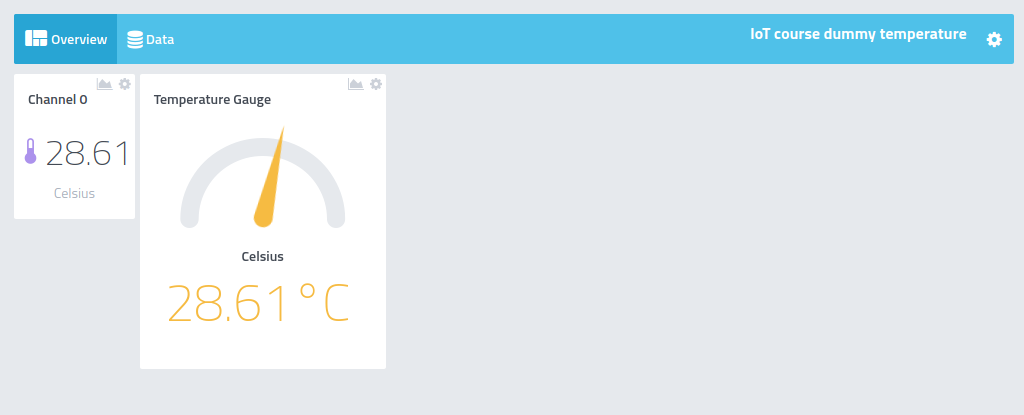
Write a program that sends dummy temperature values to Cayenne on channel 0. The temperature values should range from 25°C to 35°C (typical Ghanaian temperatures). Use the random number generator in MicroPython to make the values vary. Wait for 2 s minimum between each value. Observe the widget coming up on the dashboard. Fix the widget on the dashboard and change the widget parameters (e.g. the name).Exercise 6:
Add a gauge widget with ranges 0 .. 50 °C. Run your program sending the dummy temperatures and observe how the dashboard displays them.Here is a screen dump showing the result:

Exercises 7:
Create a slider and a push button on your dashboard.Exercise 8:
Create a temperature and a humidity widget on the Cayenne dashboard. Write a program that connects to Cayenne and sends temperature and humidity values read from the SHT30 to Cayenne every 5s. Observe the measurements on the dash board. Add two line charts for temperature and humidity and observe how the plots evolve over time. You may also try to download the measurements saved on the plots.Exercise 9:
Add a push button to the dashboard and connect it to the built-in LED on the ESP32 CPU board. Try to switch the LED on and off using this button. The dashboard should now look like this: As you can see, the LED is currently switched on.
Exercise 10:
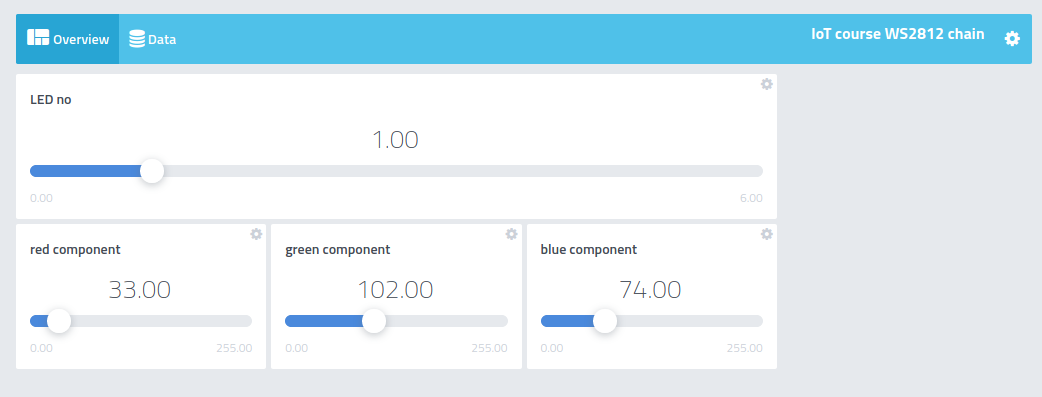
Create 4 sliders on the dashboard. The first one will select one of the 7 LEDs on the WS2812 RGB LED chain while the other 3 will select the red, green and blue component for the LED selected. With the settings in the screen dump below we will get a light blue color on LED1 (top LED in the ring). --
-- Comments
| I | Attachment | History | Action | Size | Date | Who | Comment |
|---|---|---|---|---|---|---|---|
| |
cayenneDummy.png | r1 | manage | 27.0 K | 2020-09-05 - 14:47 | UliRaich | |
| |
dashboard.png | r1 | manage | 68.6 K | 2020-09-04 - 12:58 | UliRaich | |
| |
ws2812Cayenne.png | r1 | manage | 27.0 K | 2020-09-05 - 13:59 | UliRaich |
Ideas, requests, problems regarding TWiki? Send feedback


